
TapClicks Data Visualizations
Upgrade your data storytelling with advanced visualization tools that simplify analysis and enhance insights.
Transform Data into Dynamic Visual Stories
TapClicks offers a wide range of comprehensive tools, customizable designs, and enhanced insights to meet all your data storytelling needs. Our user-friendly interface ensures a seamless experience for creating and modifying visualizations, even for non-technical users. Whether you're a small business or a large enterprise, our scalable solutions support growth and increasing data complexity, allowing for smarter, data-driven decisions.
Big Number
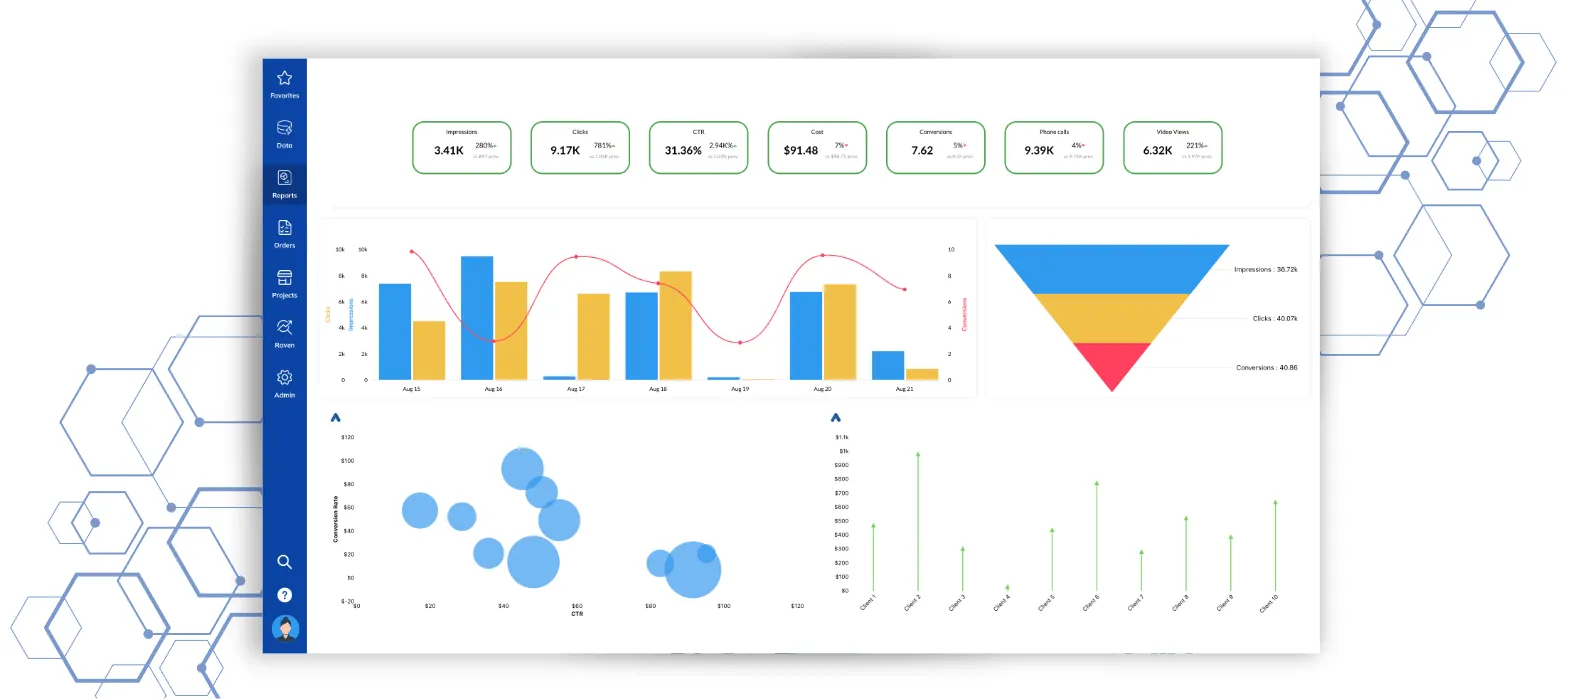
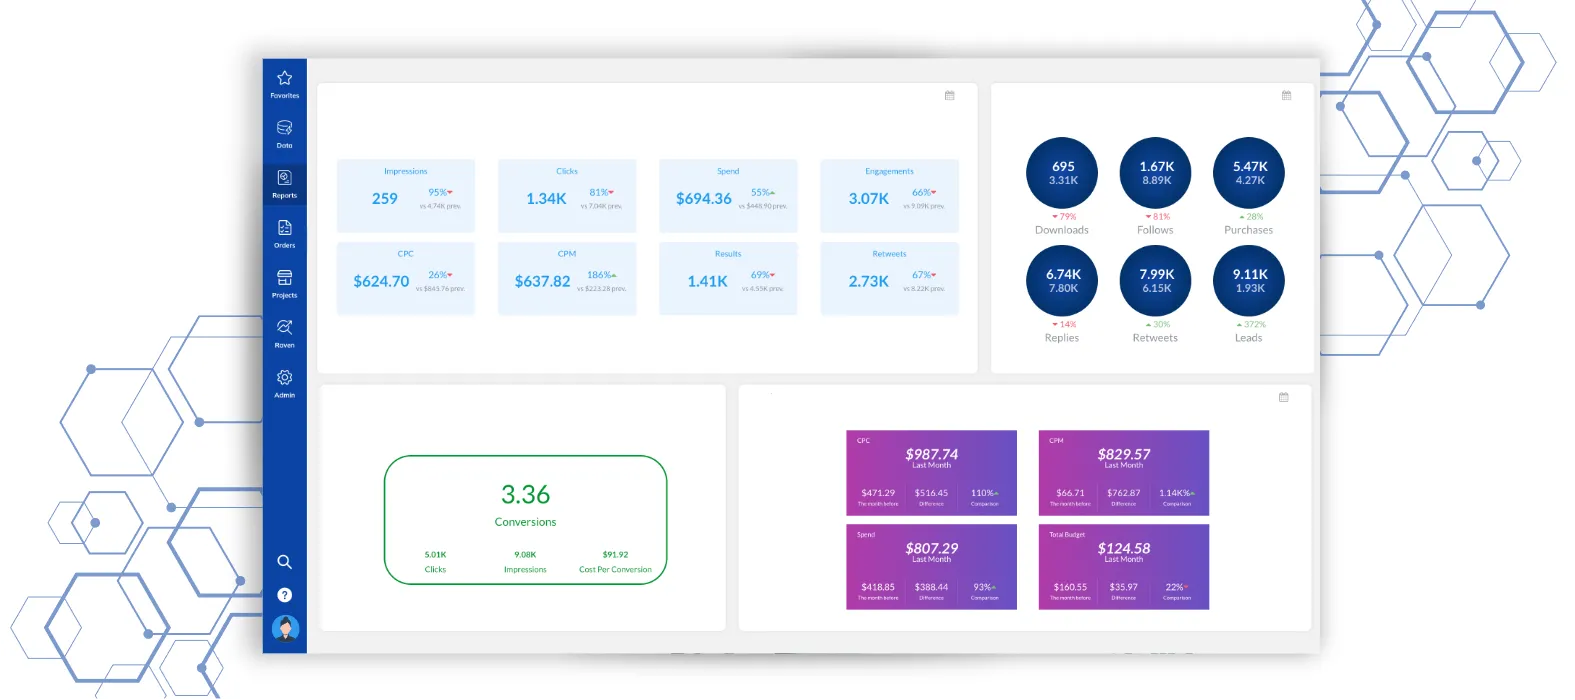
Display one or more prominent numerical values, ideal for highlighting KPIs or metrics. Big numbers provide quick overviews and are great eye-catchers.
Best Use: Highlight key metrics that need to stand out, such as the total number of followers, likes, clicks, or impressions.
Styling & Features: Plot types include Multi Metric, Comparison, Sparkline, with various styling options such as compact number, display in center, and wrap metric name.
![]() Include big numbers at the top of your dashboard for a quick overview.
Include big numbers at the top of your dashboard for a quick overview.
Data Grid
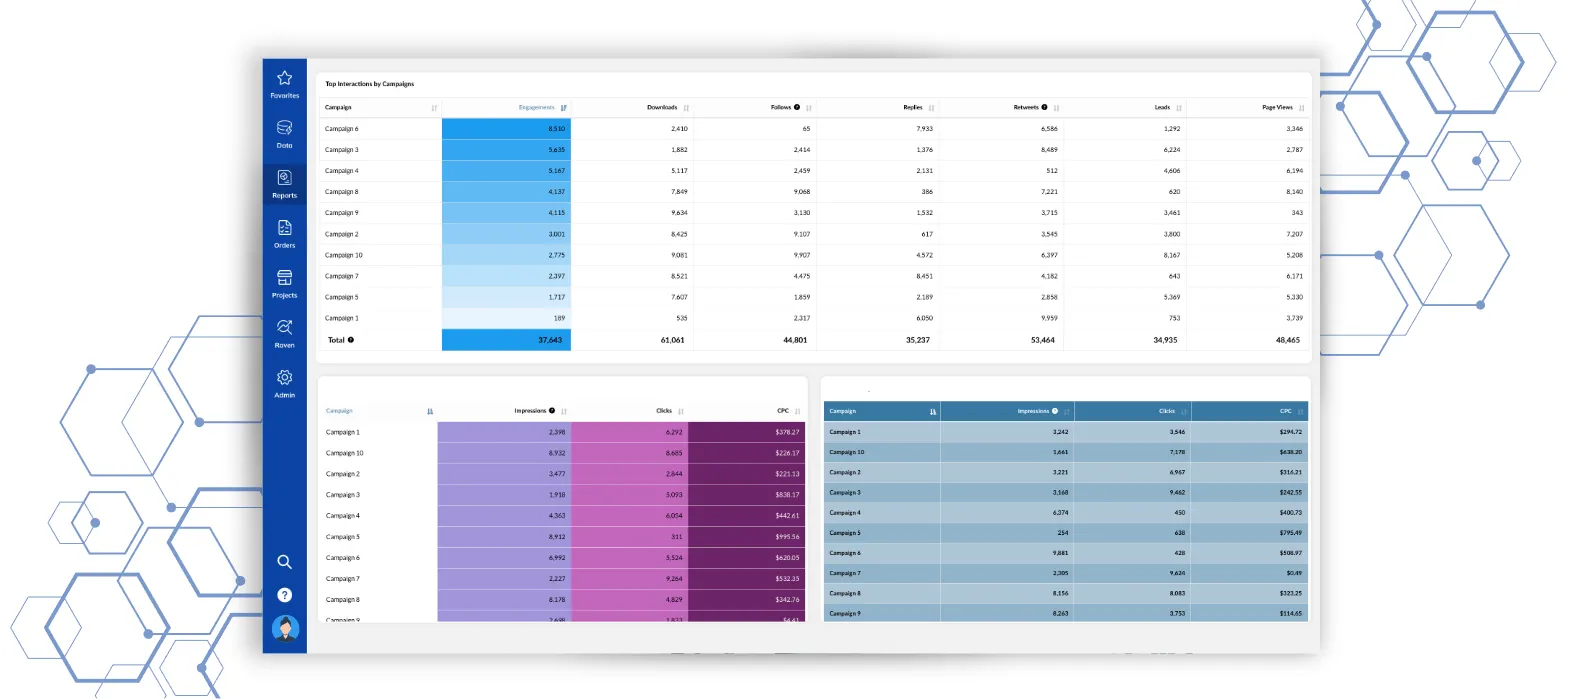
Tabular representation of data, similar to a spreadsheet. Ideal for displaying all data in a table format.
Best Use: Display large datasets where users need to see multiple fields and records simultaneously, such as marketing metrics like clicks and CPC for several clients at once.
Styling & Features: Plot types include Heatmap, Conditional Map, Grouped Column, with various styling options such as collapse overflowing columns, apply alternating row color, show total, and paginate records.
![]() Enhance the table visually by grouping columns by color and using heat maps.
Enhance the table visually by grouping columns by color and using heat maps.
Bar Chart
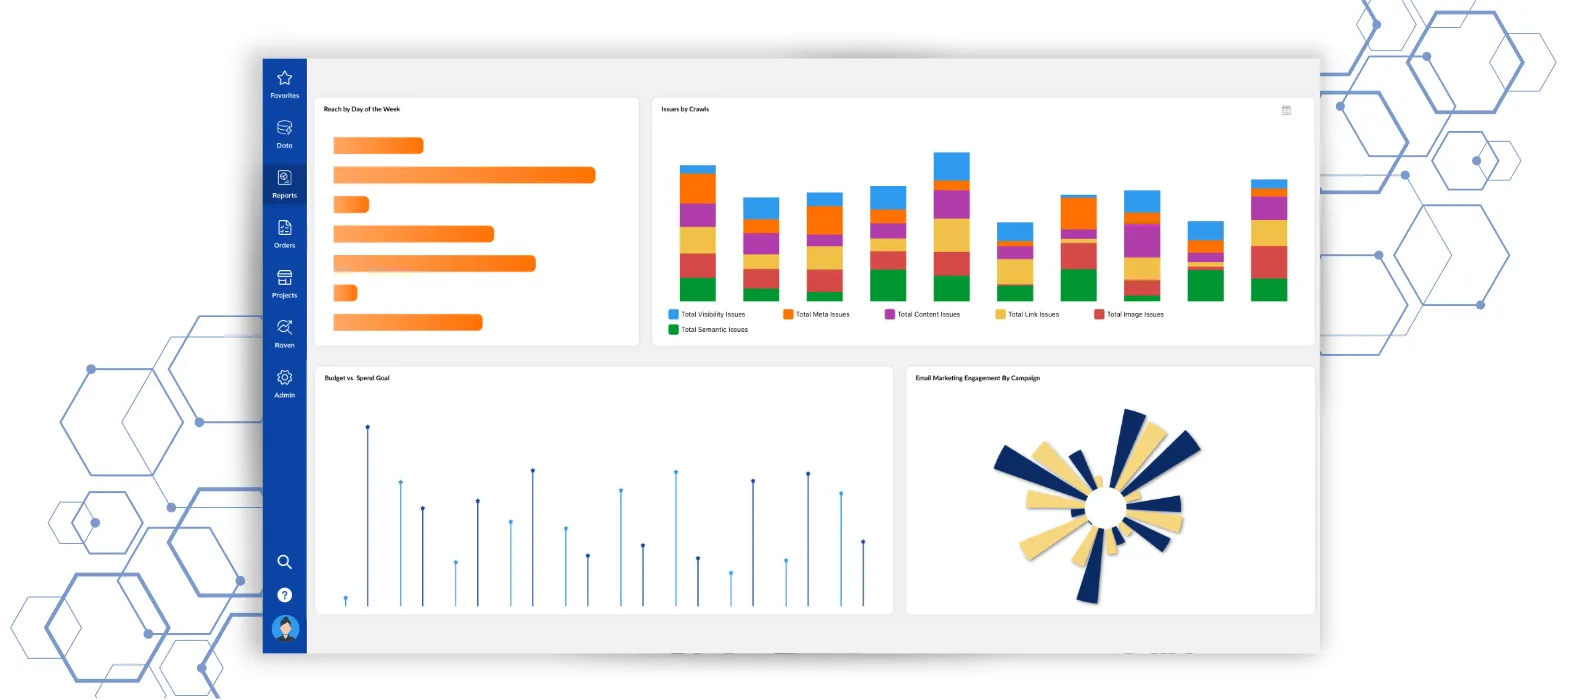
Use horizontal or vertical bars to represent data values, making it quick to compare information.
Best Use: Compare quantities across different categories, such as the volume of likes, comments, and shares or website traffic by origination site.
Styling & Features: Plot types include Clustered, Stacked, Radial Bar/Histogram, Lollipop Chart, with various styling options such as show empty dates, show legend, rotate chart, and show labels.
![]() Use stacked or side-by-side bars for deeper analysis, and group multiple bar charts together for quick comparison.
Use stacked or side-by-side bars for deeper analysis, and group multiple bar charts together for quick comparison.
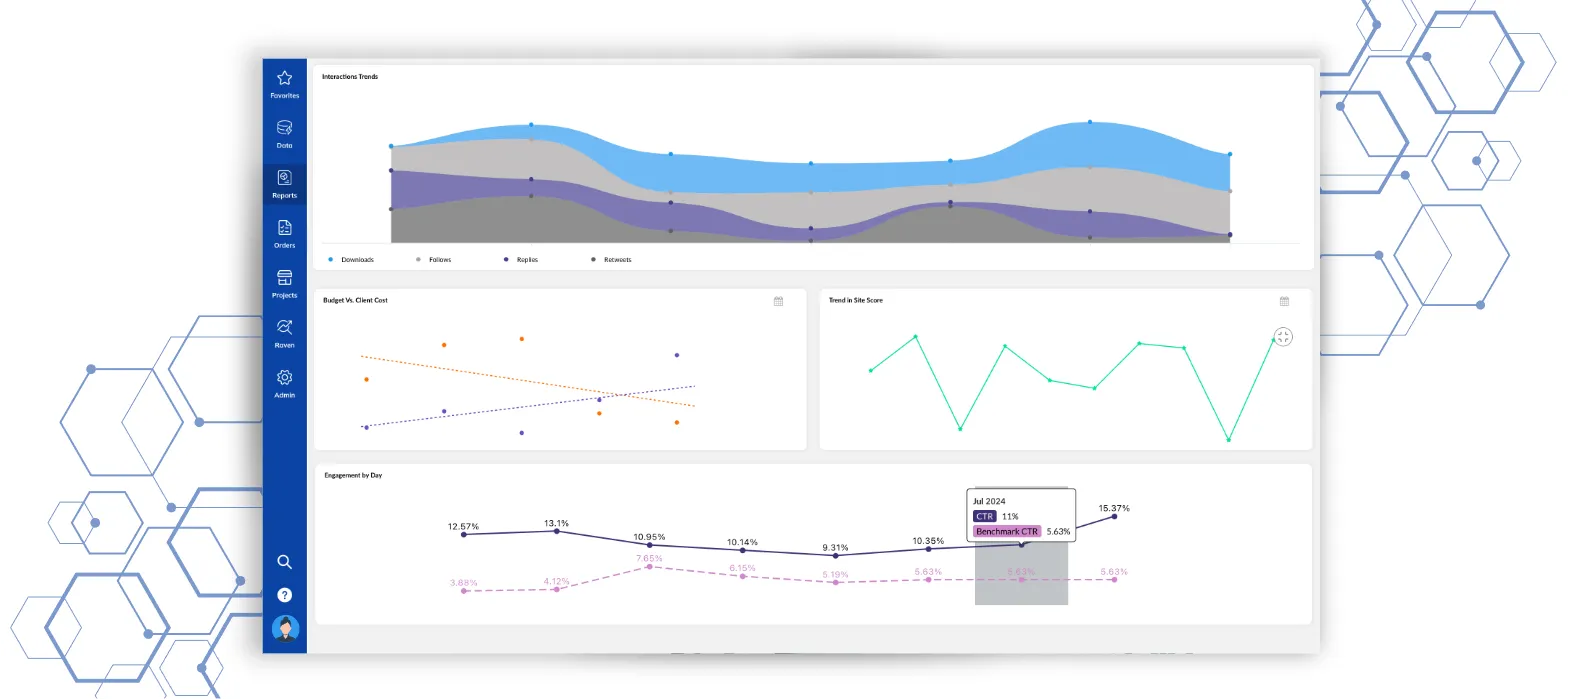
Line Chart
Plot data points on a graph and connect them with a line, making it a straightforward way to visualize trends over time.
Best Use: Show trends over time, such as engagement growth over a monthly period, website page views during a month, and revenue growth by quarter.
Styling & Features: Plot types include Stacked, 100% Stacked, Area Chart, with various styling options such as show empty dates, use smooth lines, show legend, and hide grid lines.
![]() Create area charts by shading the area under the lines to show relative contributions.
Create area charts by shading the area under the lines to show relative contributions.
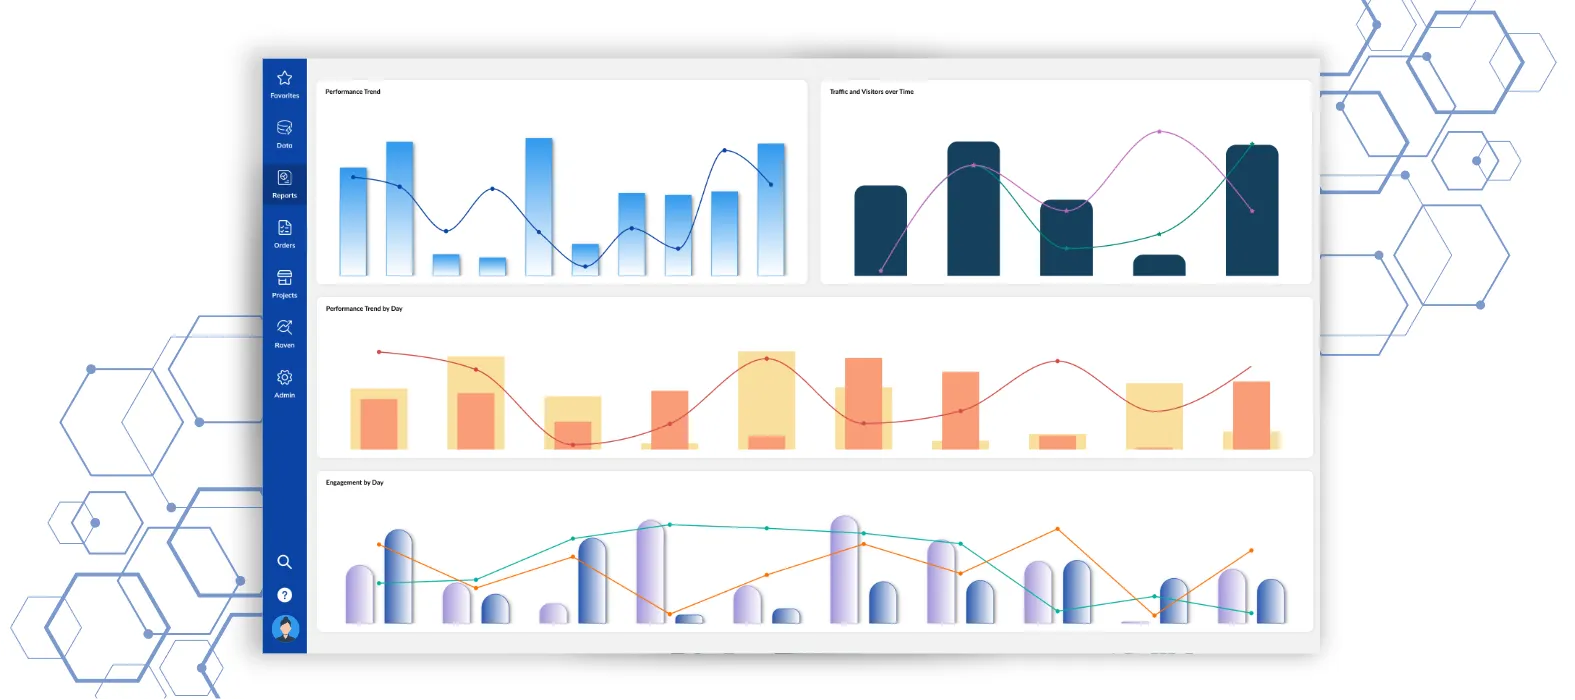
Combo Chart
Combine bar and line chart types in a single graph, allowing you to visualize different types of information together.
Best Use: Compare different types of data in a single visualization, especially when the range of values varies widely.
Styling & Features: Plot types include Clustered, Stacked, 100% Stacked, Layered style options, with various styling options such as show empty dates, show legend, normalize data, and show labels.
![]() Ensure your metrics are related and their scales do not overshadow each other.
Ensure your metrics are related and their scales do not overshadow each other.
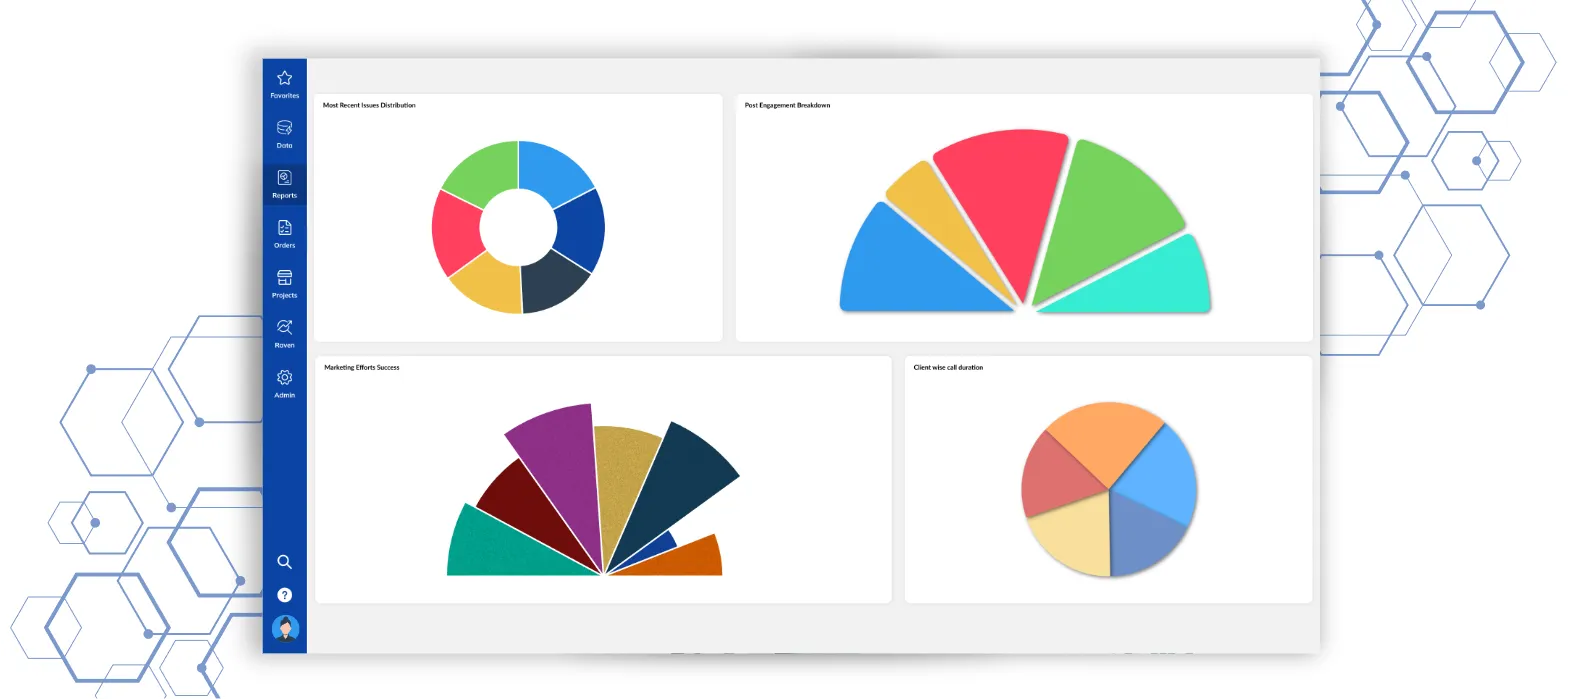
Pie Chart
Divide a circle into slices to represent data proportions, ideal for showing relative proportions within a whole.
Best Use: Show proportions, such as the percentage of budget spent on different campaigns or demographic channels from a survey.
Styling & Features: Plot types include Pie and Donut Chart, with various styling options such as show legend, show labels, display label percent, and show label names.
![]() Limit pie wedges to six for better readability. Use bar charts if you have more proportions to communicate.
Limit pie wedges to six for better readability. Use bar charts if you have more proportions to communicate.
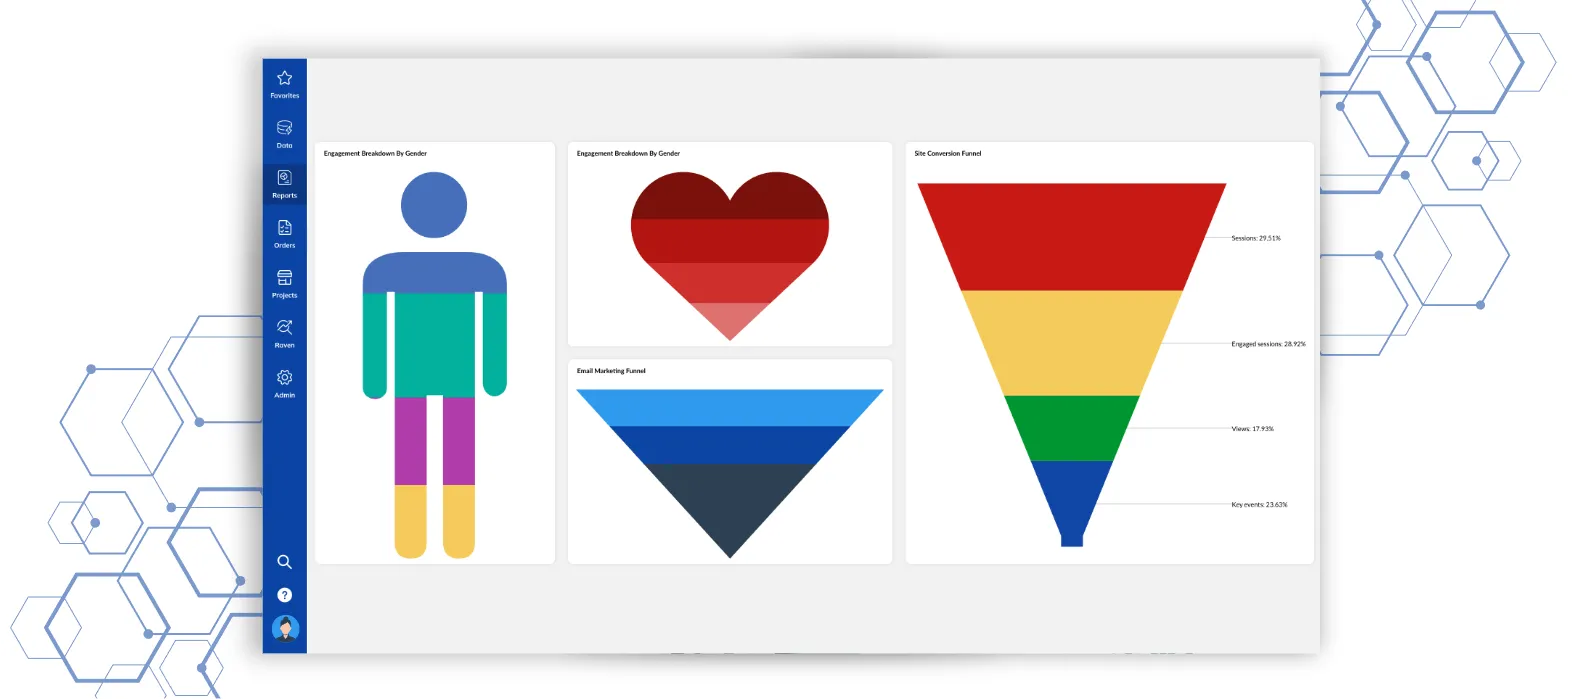
Funnel Chart
Represents stages in a process, with each stage shown as a segment, ideal for visualizing how data narrows down at each stage.
Best Use: Track progress through stages, such as tracking users from site visit to order submission.
Styling & Features: Plot types include Funnel, Pyramid, and Pictorial Charts with various styling options such as show legend, show labels, display label percent, and normalize data.
![]() Use funnel charts to identify where users drop off and strategically plan to maximize completion rates.
Use funnel charts to identify where users drop off and strategically plan to maximize completion rates.
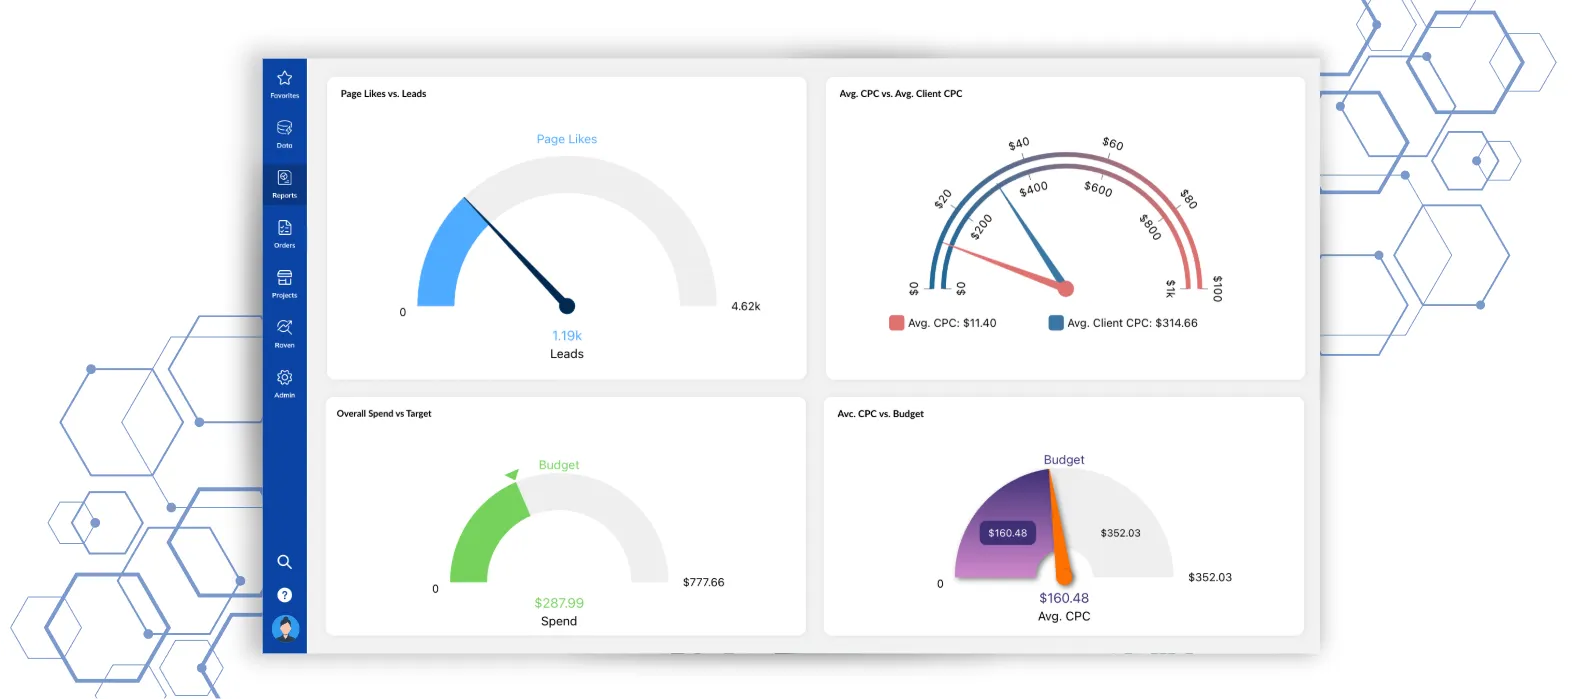
Gauge Chart
Display data in a gauge or dial format, often with a pointer indicating the value, ideal for showing performance against a target.
Best Use: Display progress against a goal, such as the number of page views month-to-date against a monthly goal.
Styling & Features: Plot types include Multi-axis Gauge Chart, with various styling options such as show labels, use hand-drawn style, and hide grid lines.
![]() Show current and prior period progress for a comprehensive view.
Show current and prior period progress for a comprehensive view.
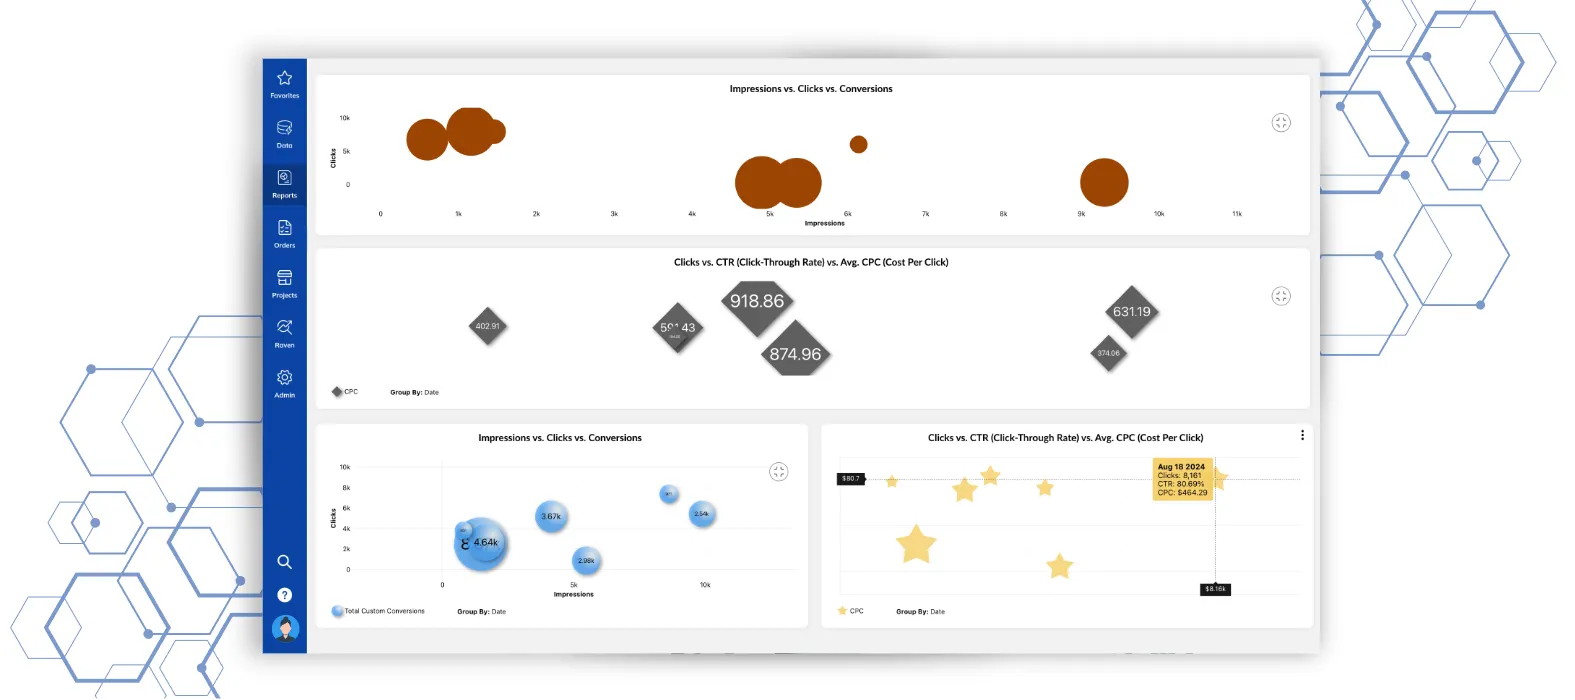
Bubble Chart
Use bubbles to represent data points on a two-dimensional axis, adding a third dimension with bubble size.
Best Use: Visualize relationships between three variables, such as tracking growth rates or market trends.
Styling & Features: Plot types include color gradient, customizable bubble shape, shape opacity, and show values on shapes.
![]() Ensure each bubble chart has three dimensions for effective visualization, and leverage bubble sizes and colors for emphasis.
Ensure each bubble chart has three dimensions for effective visualization, and leverage bubble sizes and colors for emphasis.
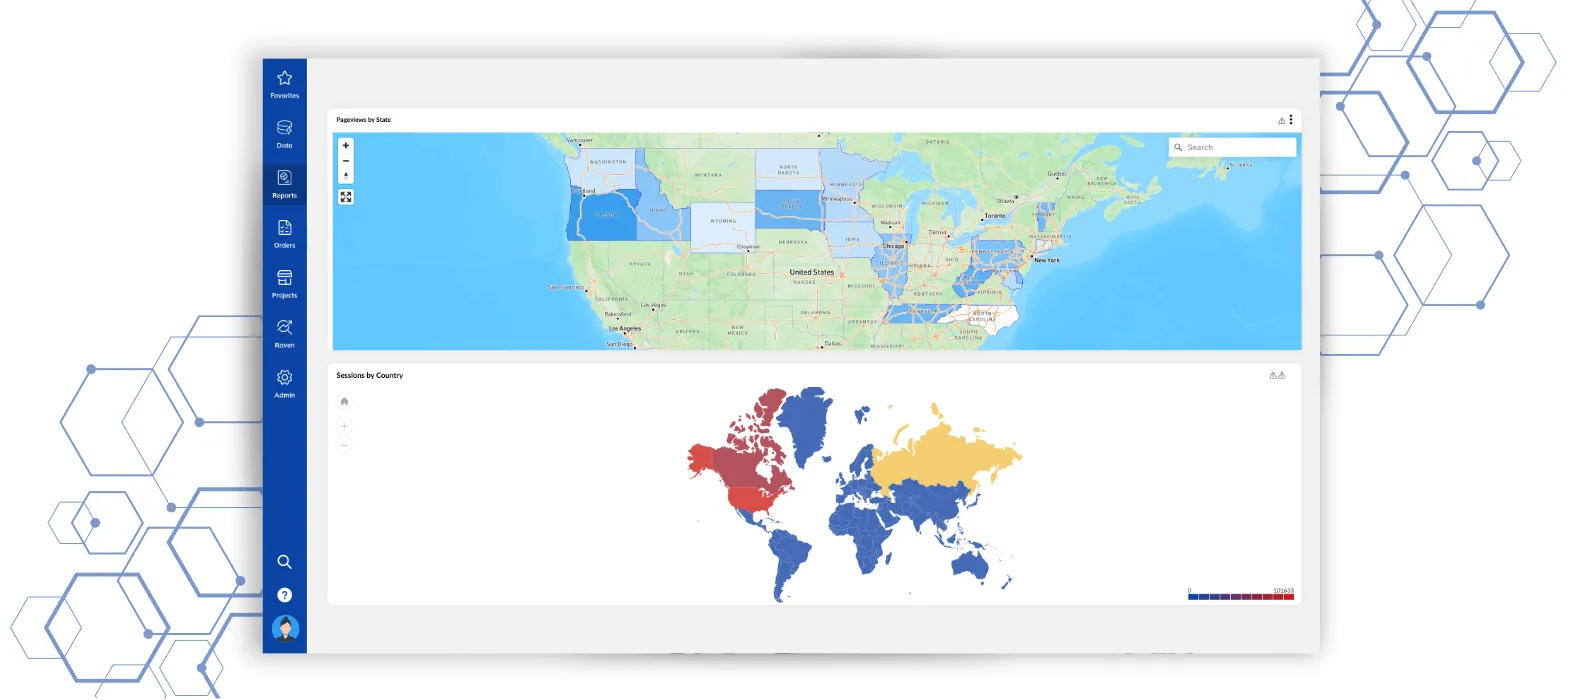
Geo Chart
Enable plotting data on maps, visualizing geographic information effectively.
Best Use: Display data with geographical components, such as sales performance by region or customer demographics by state.
Styling & Features: Plot types include HeatMap, BubbleMap, TapMap, with various styling options such as multiple map styles, hide geographic features, geo layer opacity, show widget shadow, show widget background, show widget borders, show widget title, and show data source icon.
![]() Use geographic layers for detailed and localized data visualization.
Use geographic layers for detailed and localized data visualization.
Upgrade Your Marketing Data
Designed to simplify analysis and enhance insights, our advanced visualization options empower you to make data-driven decisions with ease.
.png)
The AI-Powered Marketing Intelligence Platform. Where data intelligence becomes competitive advantage.


TapClicks © 2026. All Rights Reserved.